Fugue Composer
Company: Fugue, Inc. (2015-2018)
Role: Director of UX, Data Visualization Strategy, Product Management
Introduction
Fugue’s Composer is an IDE for writing Infrastructure as Code templates, and visualizing the infrastructure declared in a template. Fugue had its own templating language called “Ludwig” that was written in Haskell. Since Haskell is “strongly typed”, the language had built in awareness of the kind of resources that you would want to provision in your cloud environment, and how they may be connected to each other.
Product Goals
Create a new visual language for visually representing cloud resources and their relationships to each other in an elegant, beautiful, and scalable design.
Build a new code editor that would re-render in realtime the infrastructure declared in the code file being edited.
Help users better understand the Ludwig language by visually showing them how their Ludwig templates will manifest in their cloud environments as they type.
Composer Demo
Taken from a webinar video that shows the product fully built and working. The code being shown in Composer is Ludwig, and the visualization on the right shows what will be provisioned in this users AWS account.
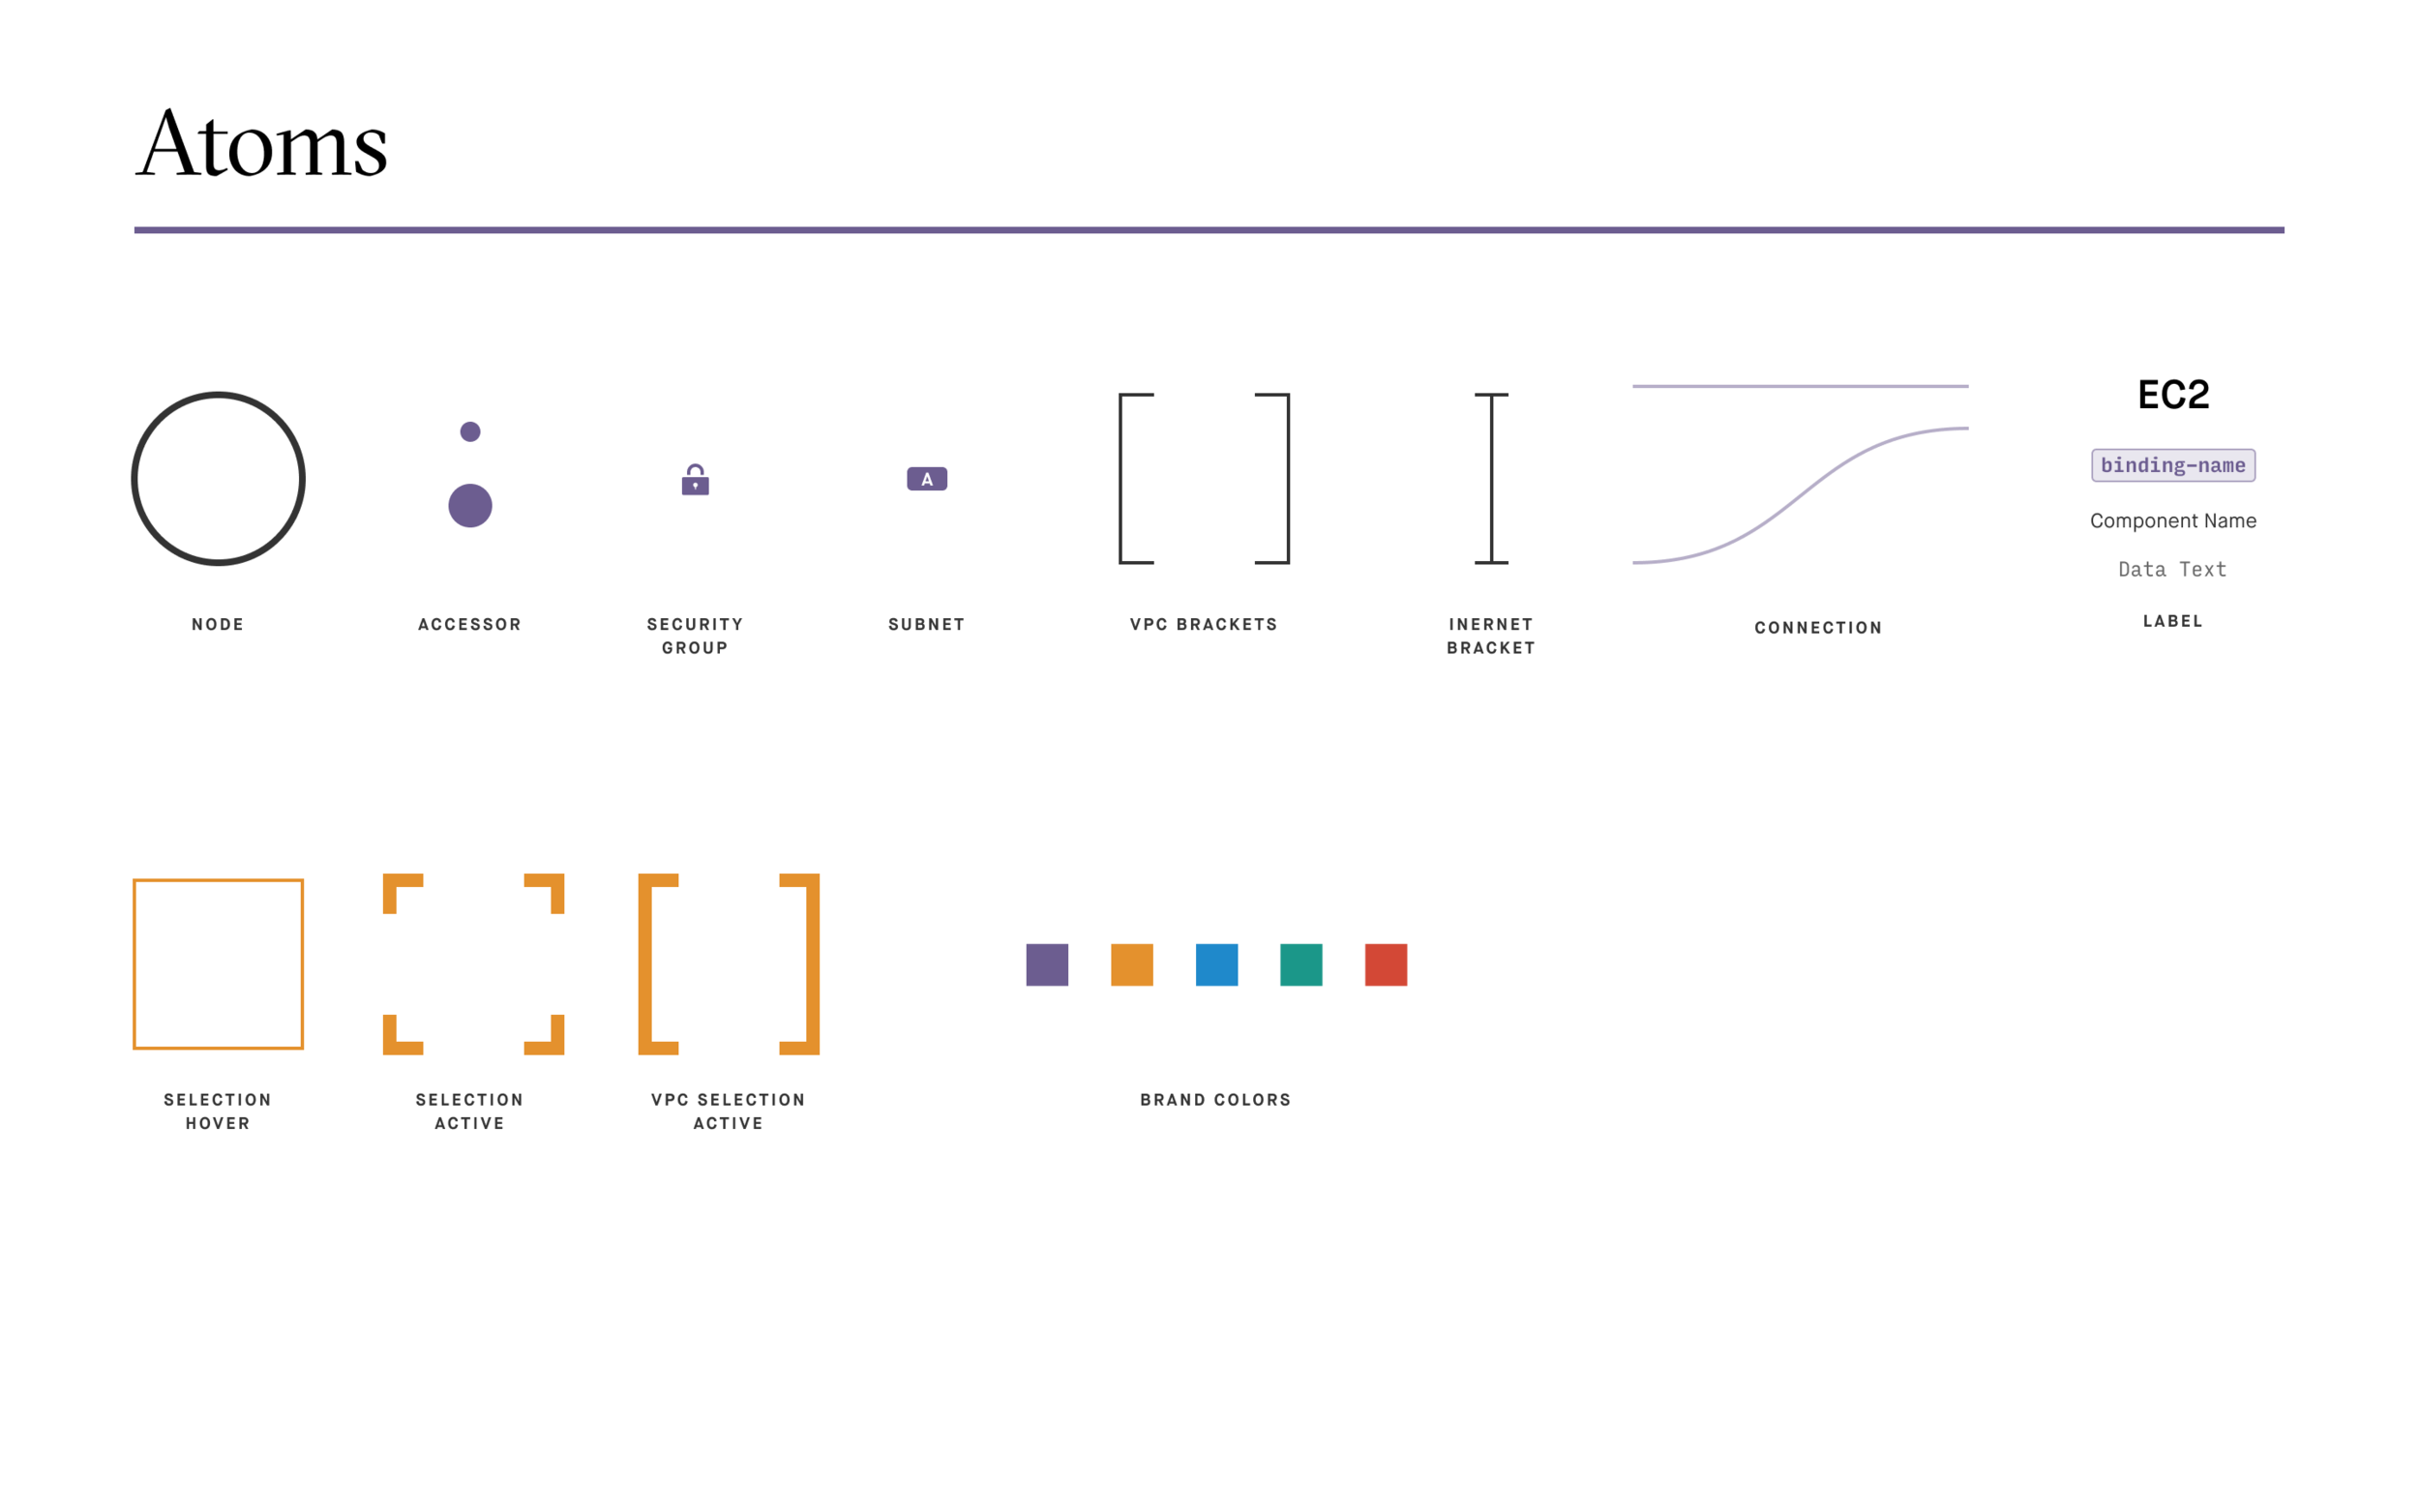
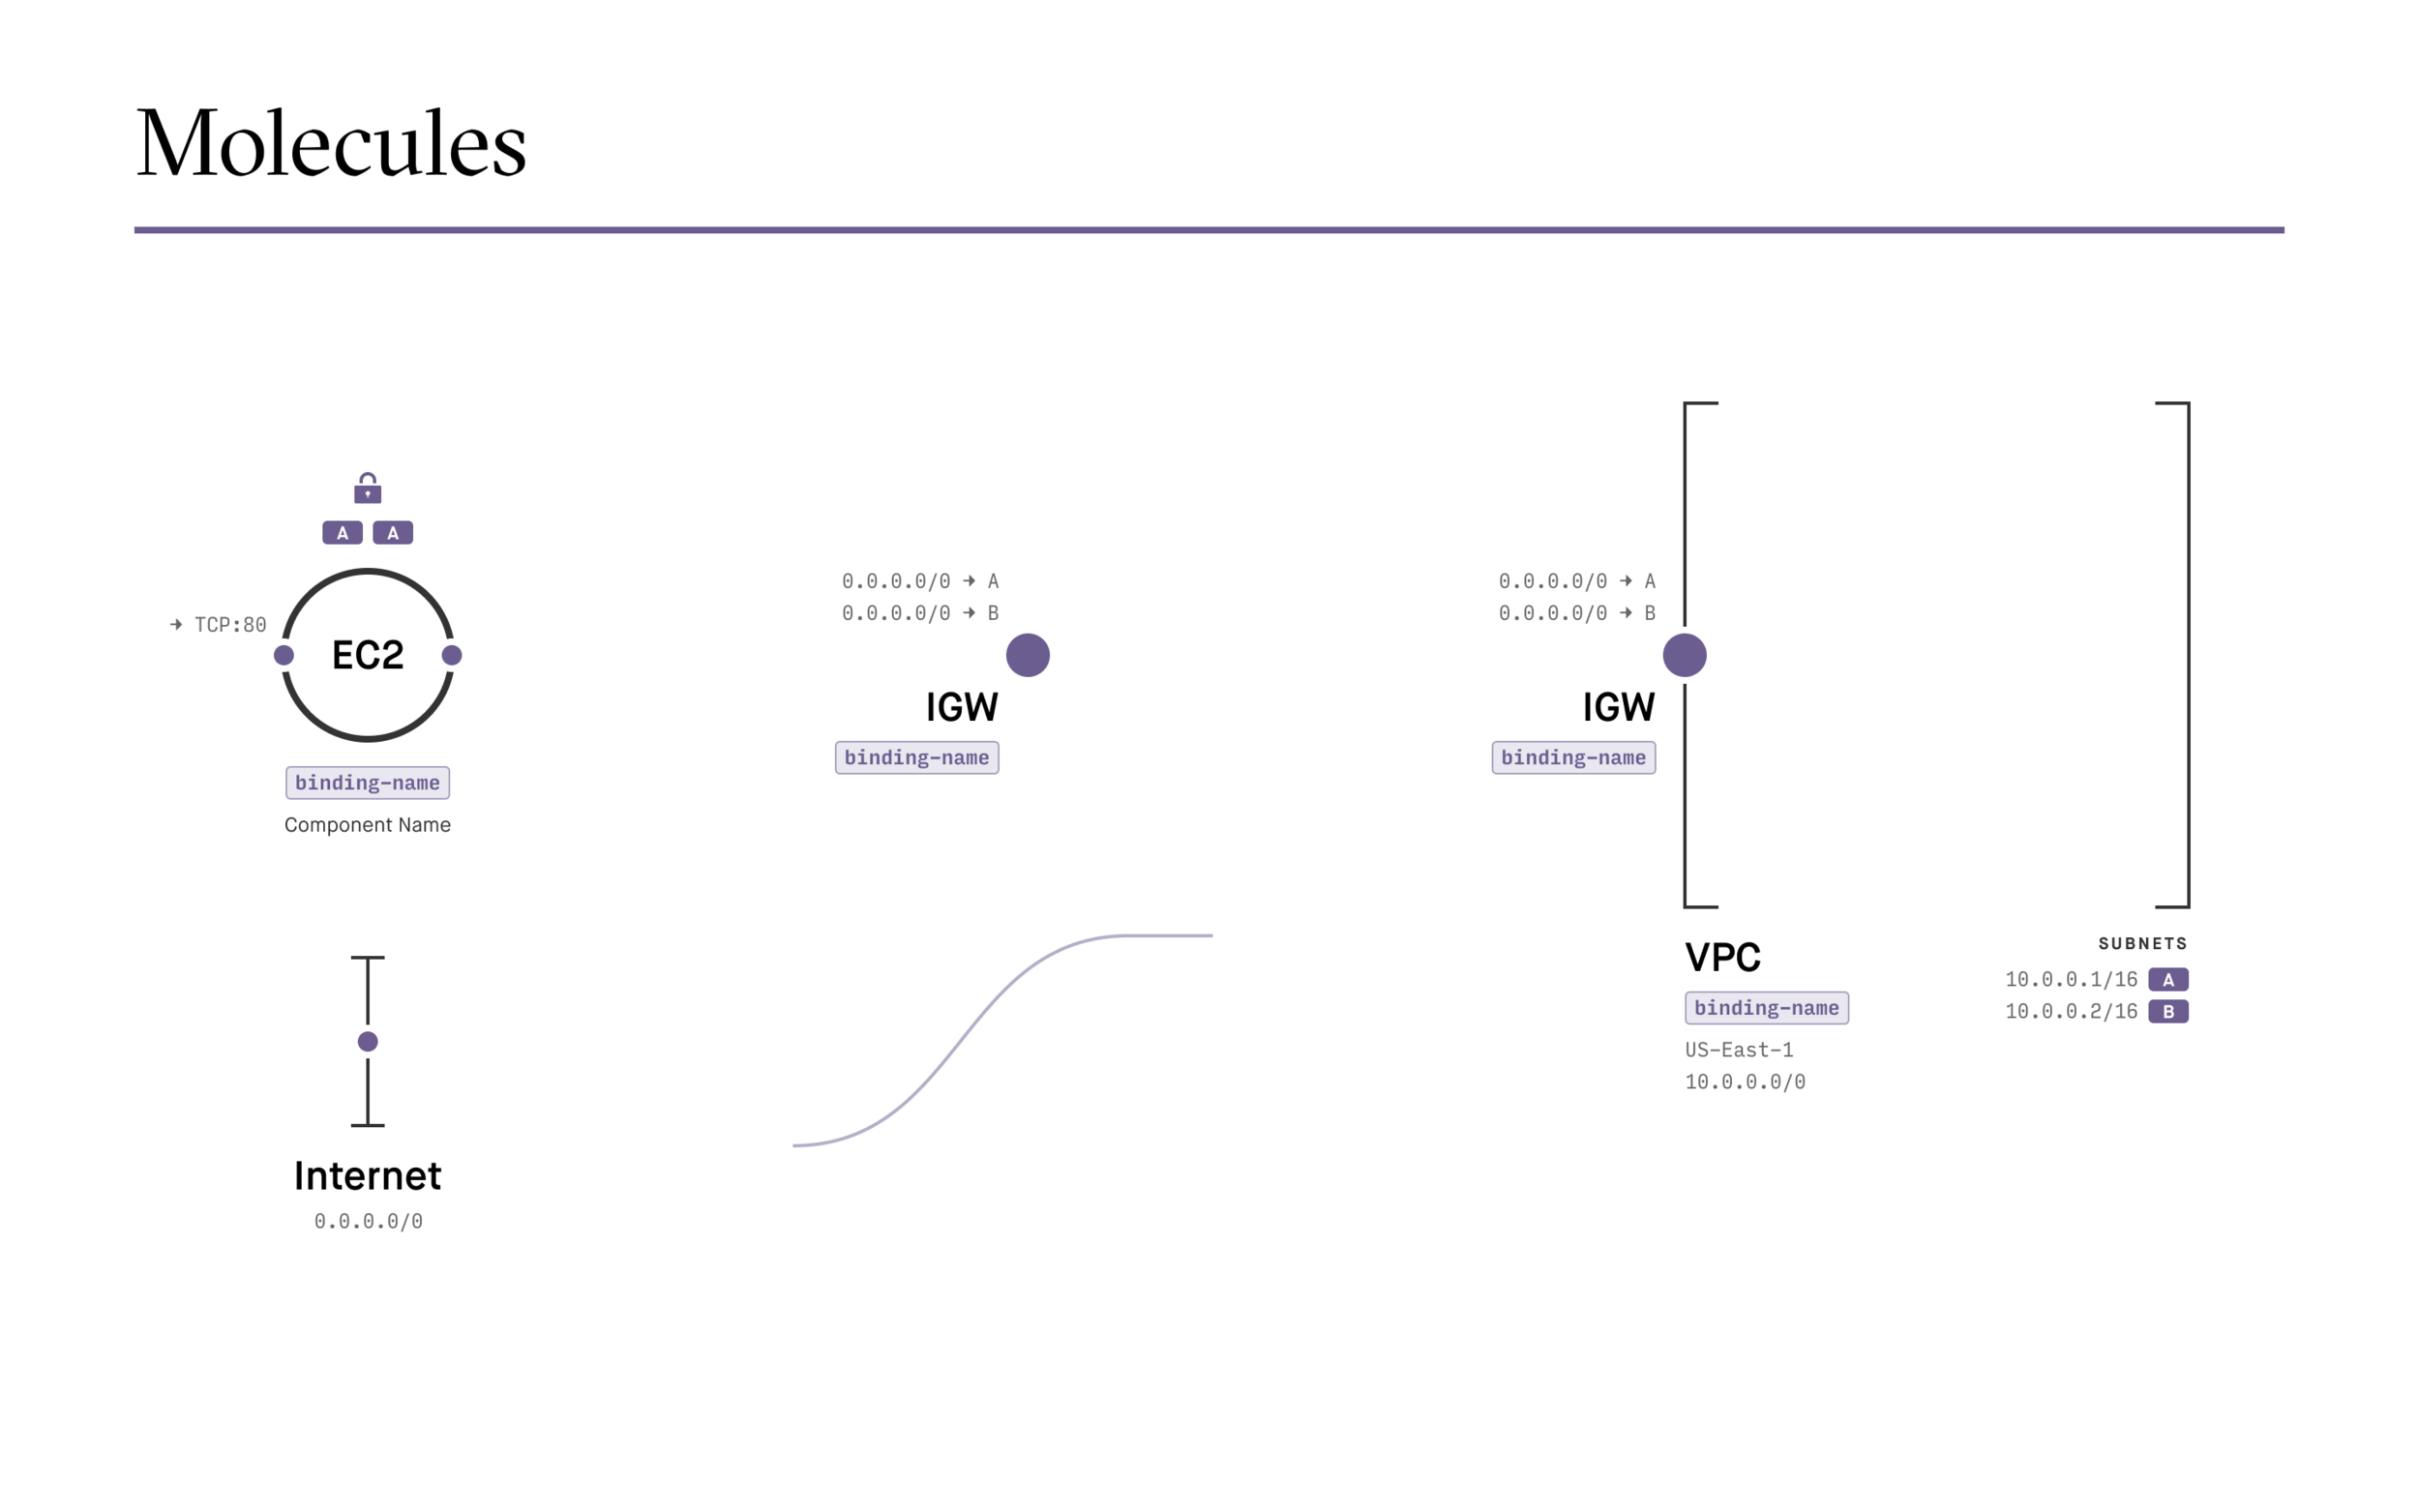
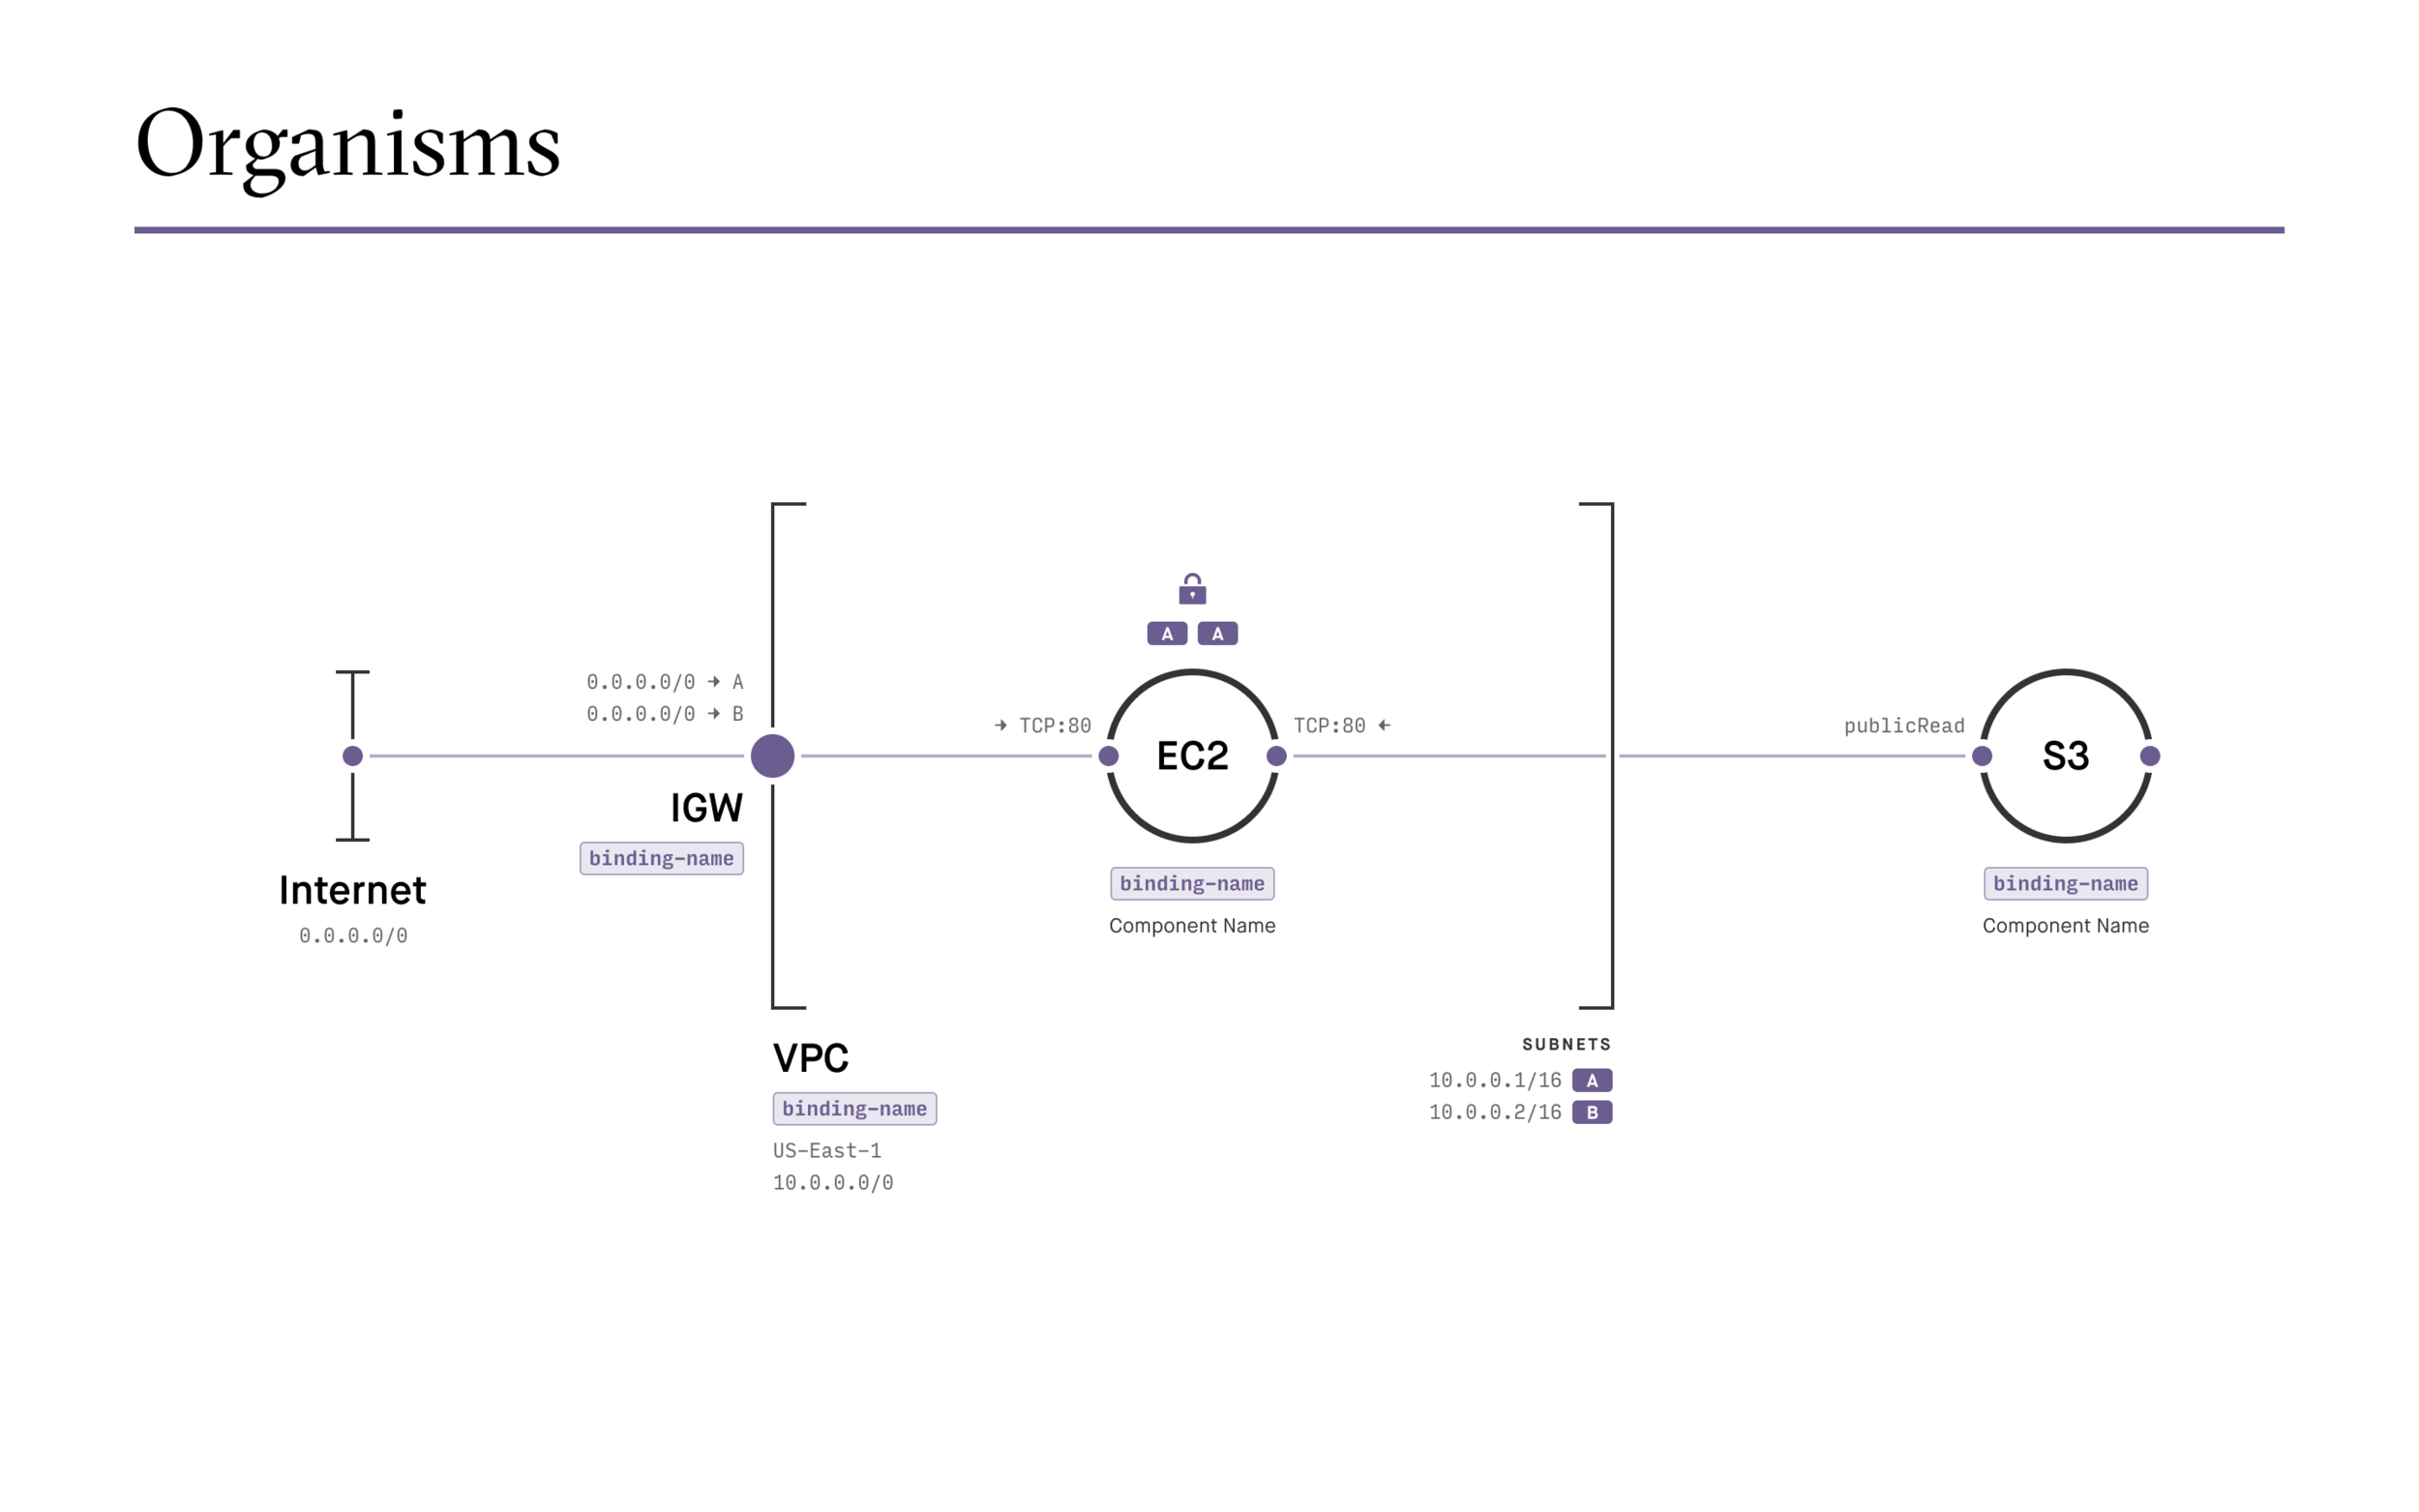
Fugue Composer's Data Visualization Language
I led the design teams in approaching the data visualization challenge from an Atomic Design point of view. Below is a deconstruction of the visual language that we developed through careful iteration. Our goals were to keep the design minimalistic, and with an eye toward ensuring we keep visual noise to a minimum due to the complexity and scale of cloud infrastructure.
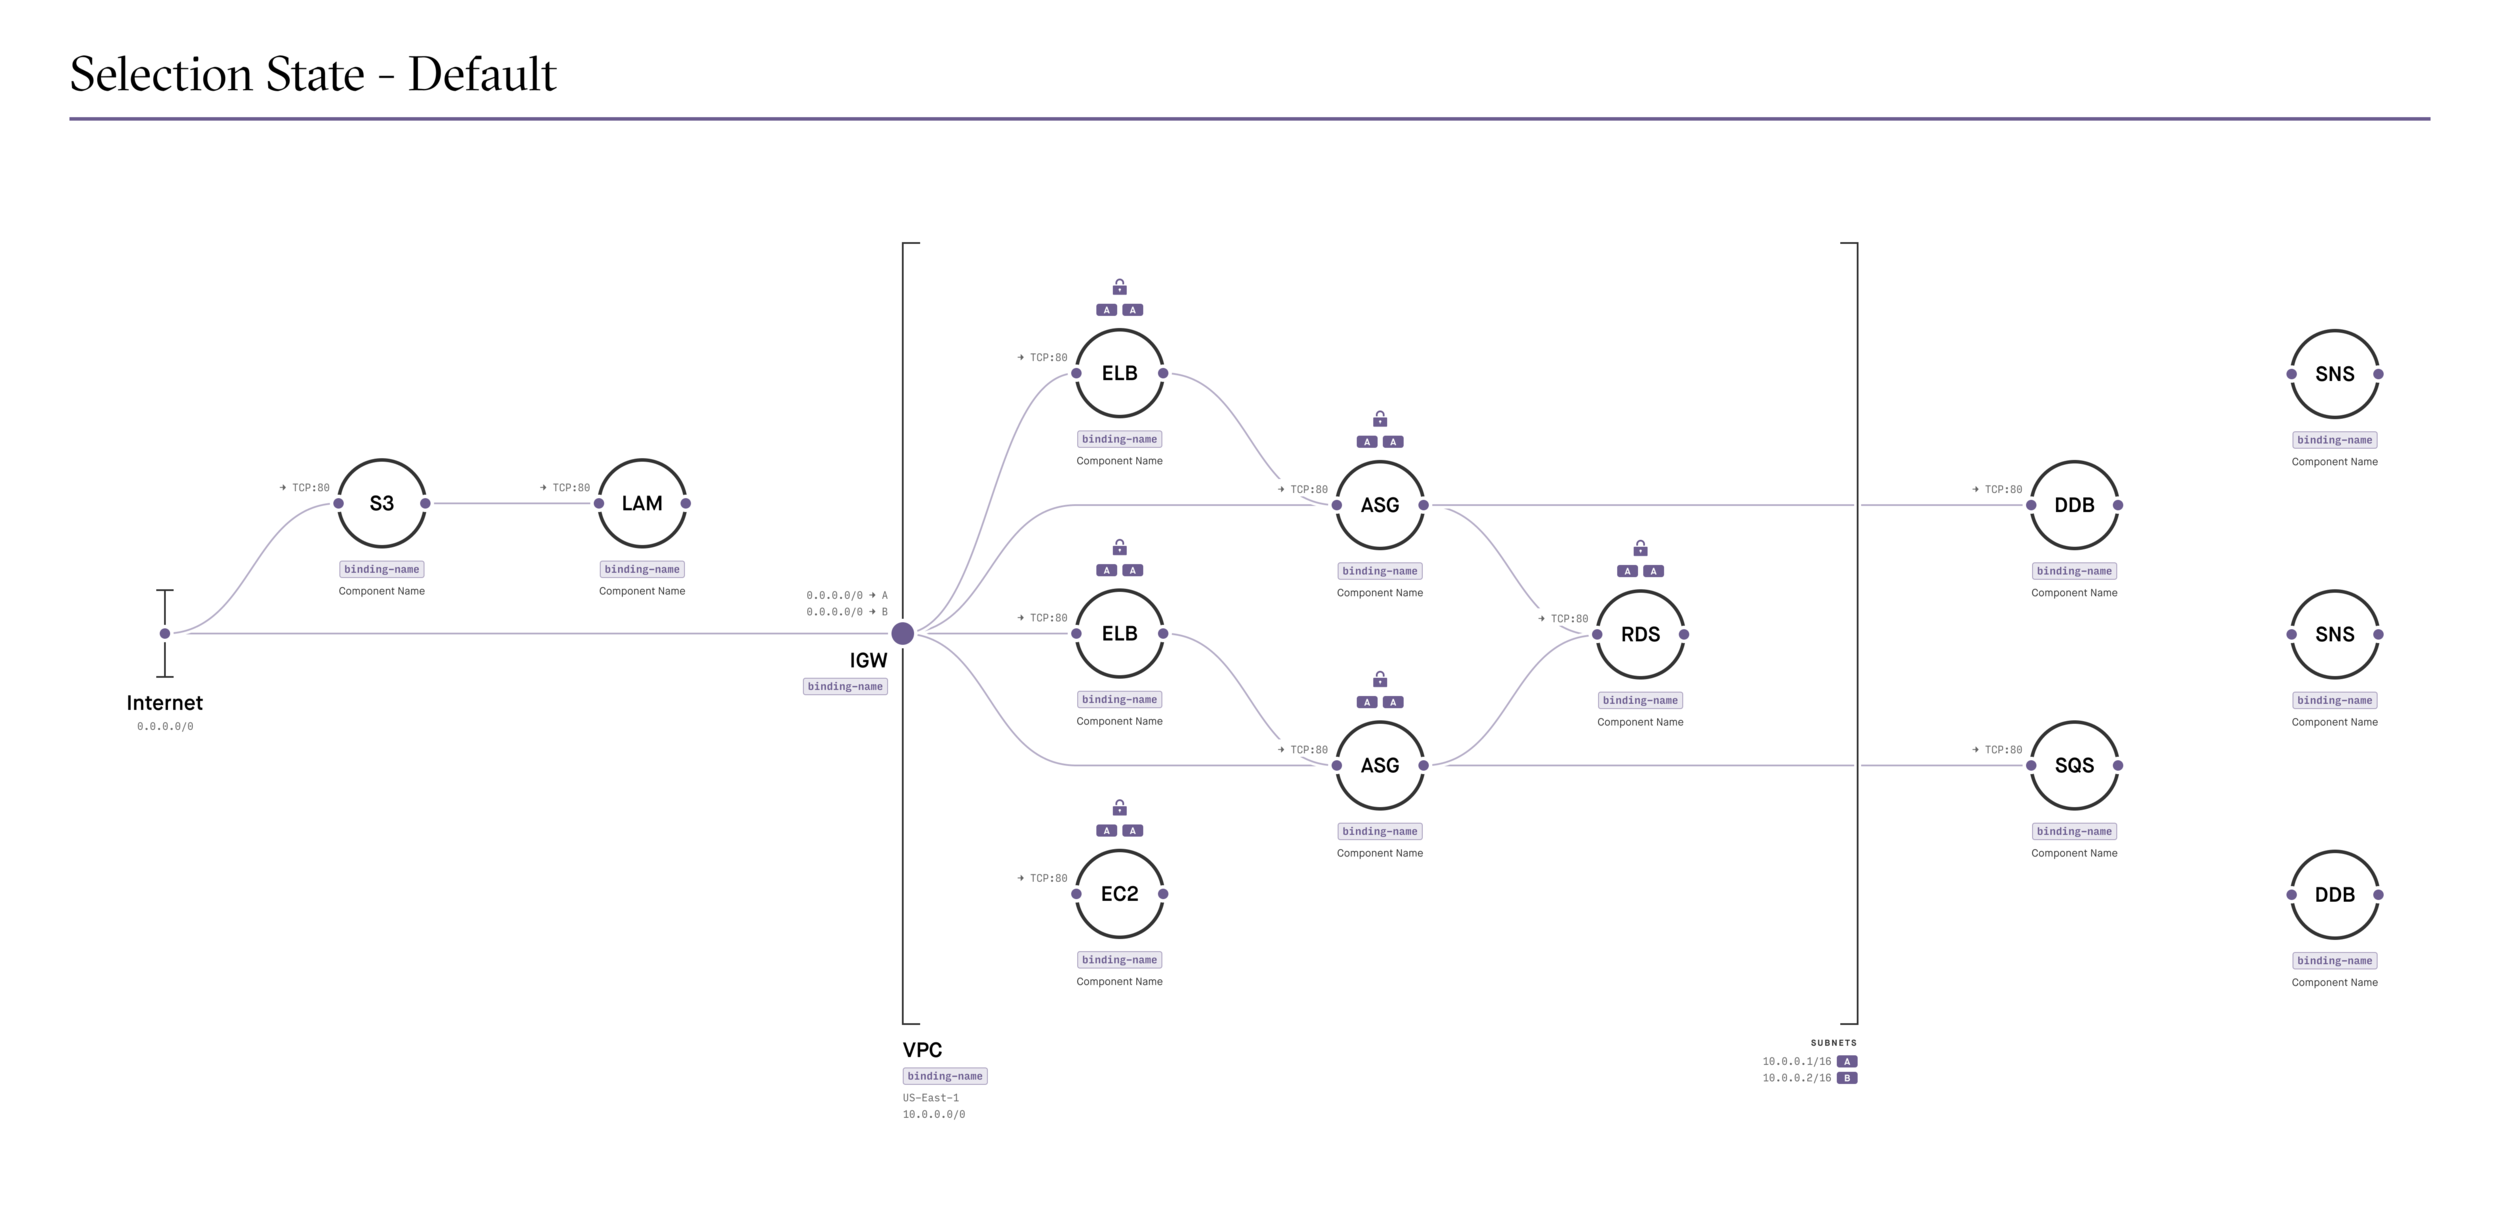
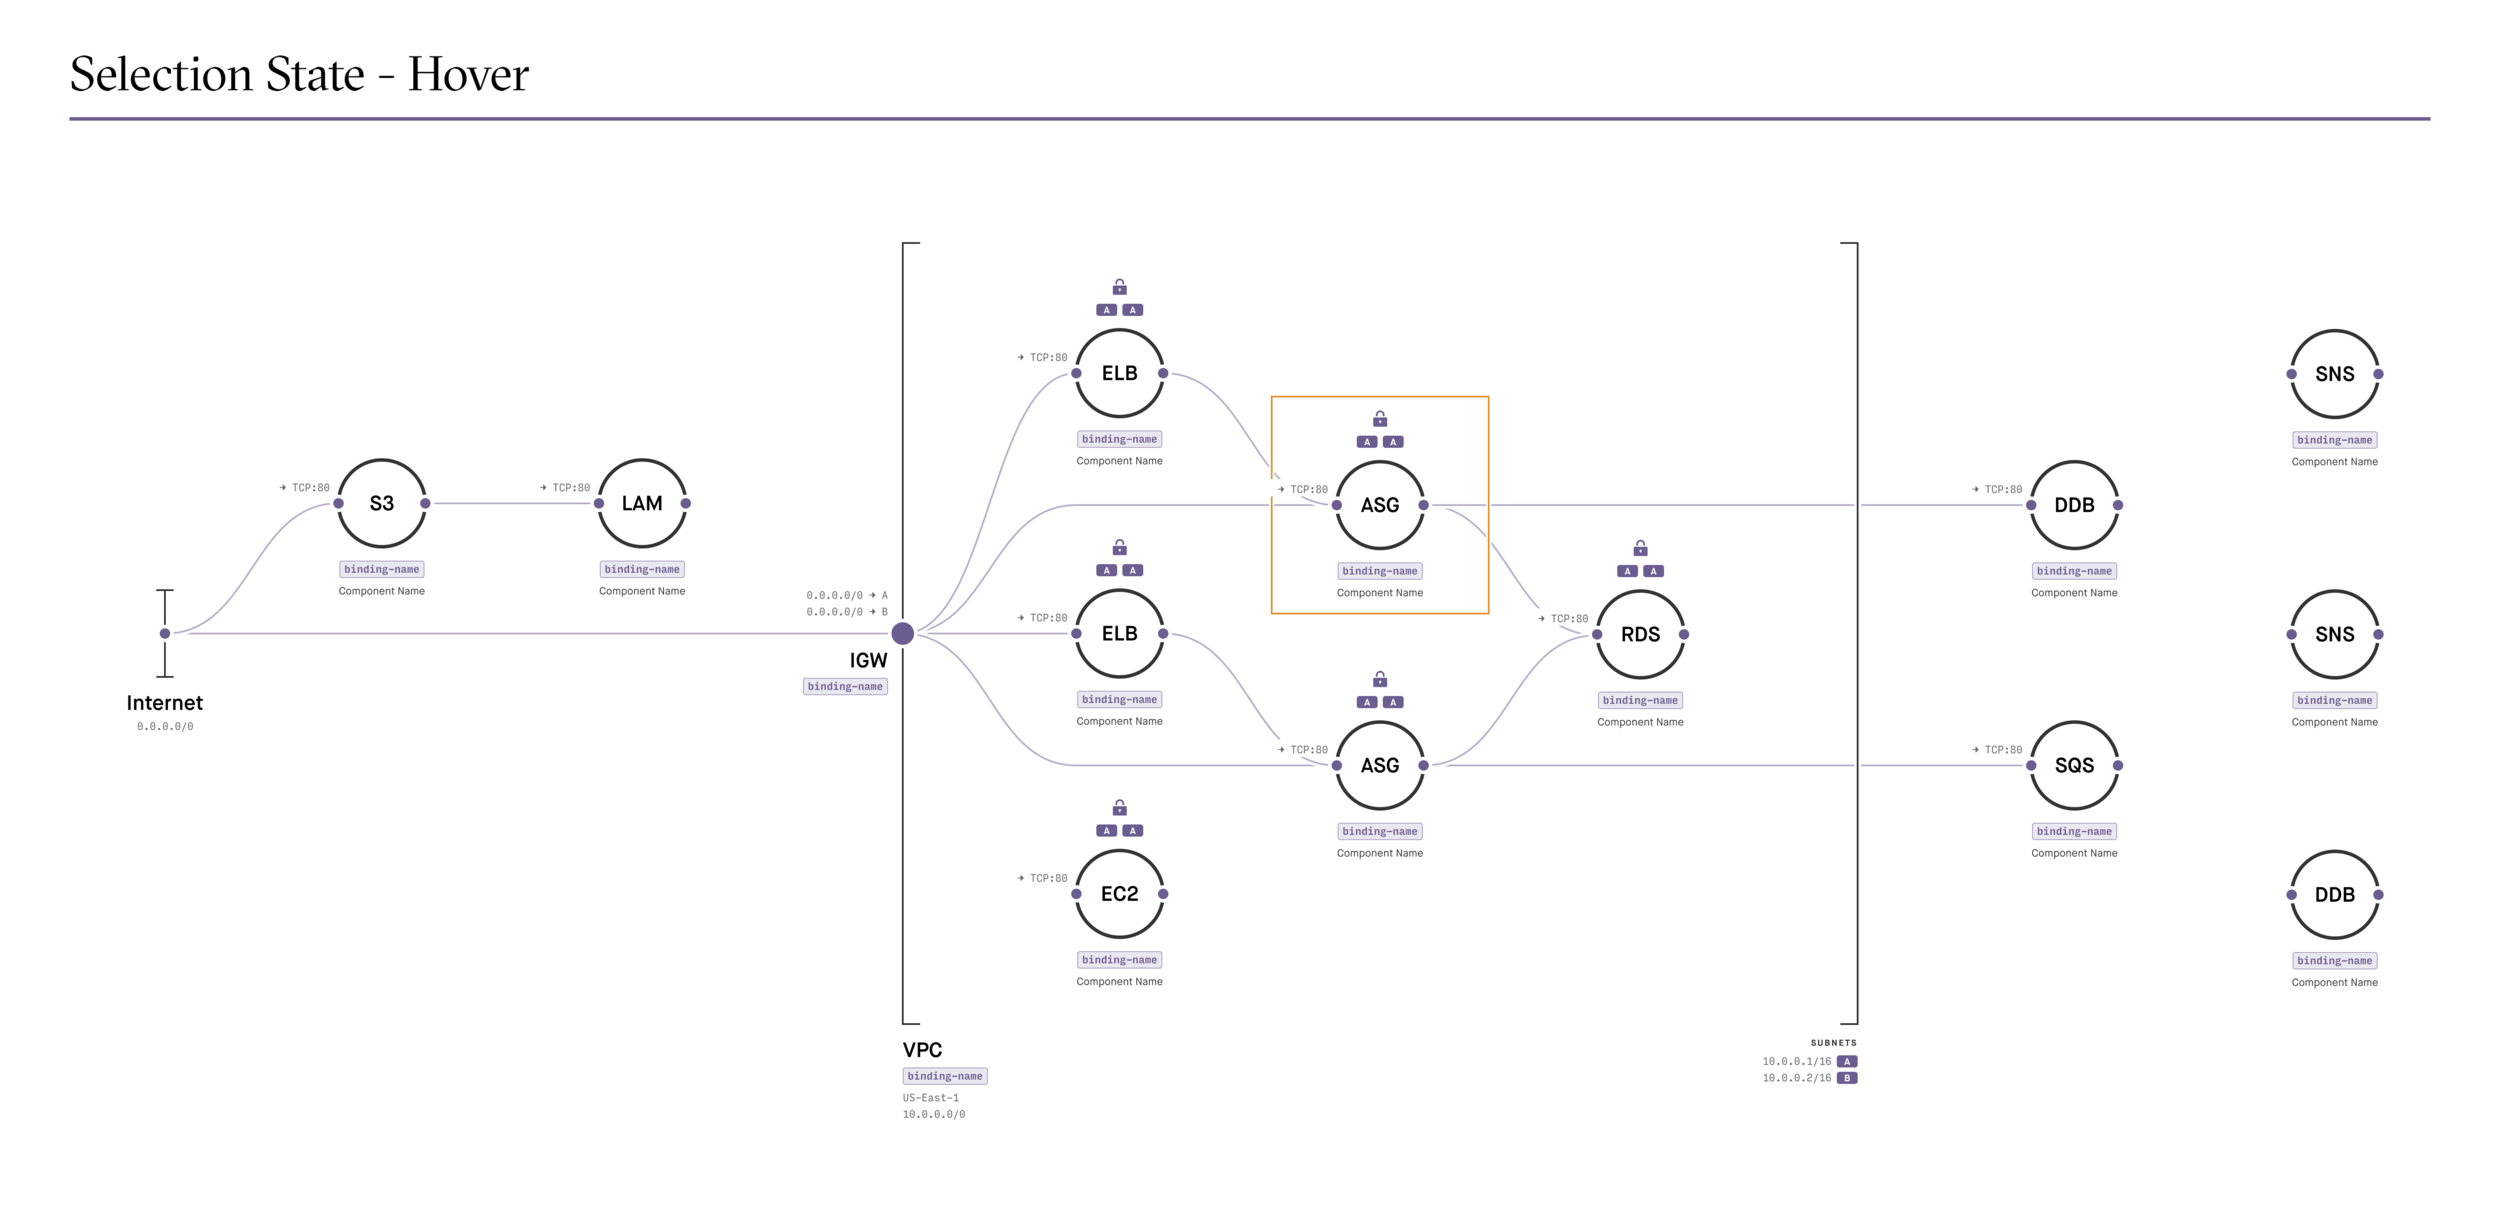
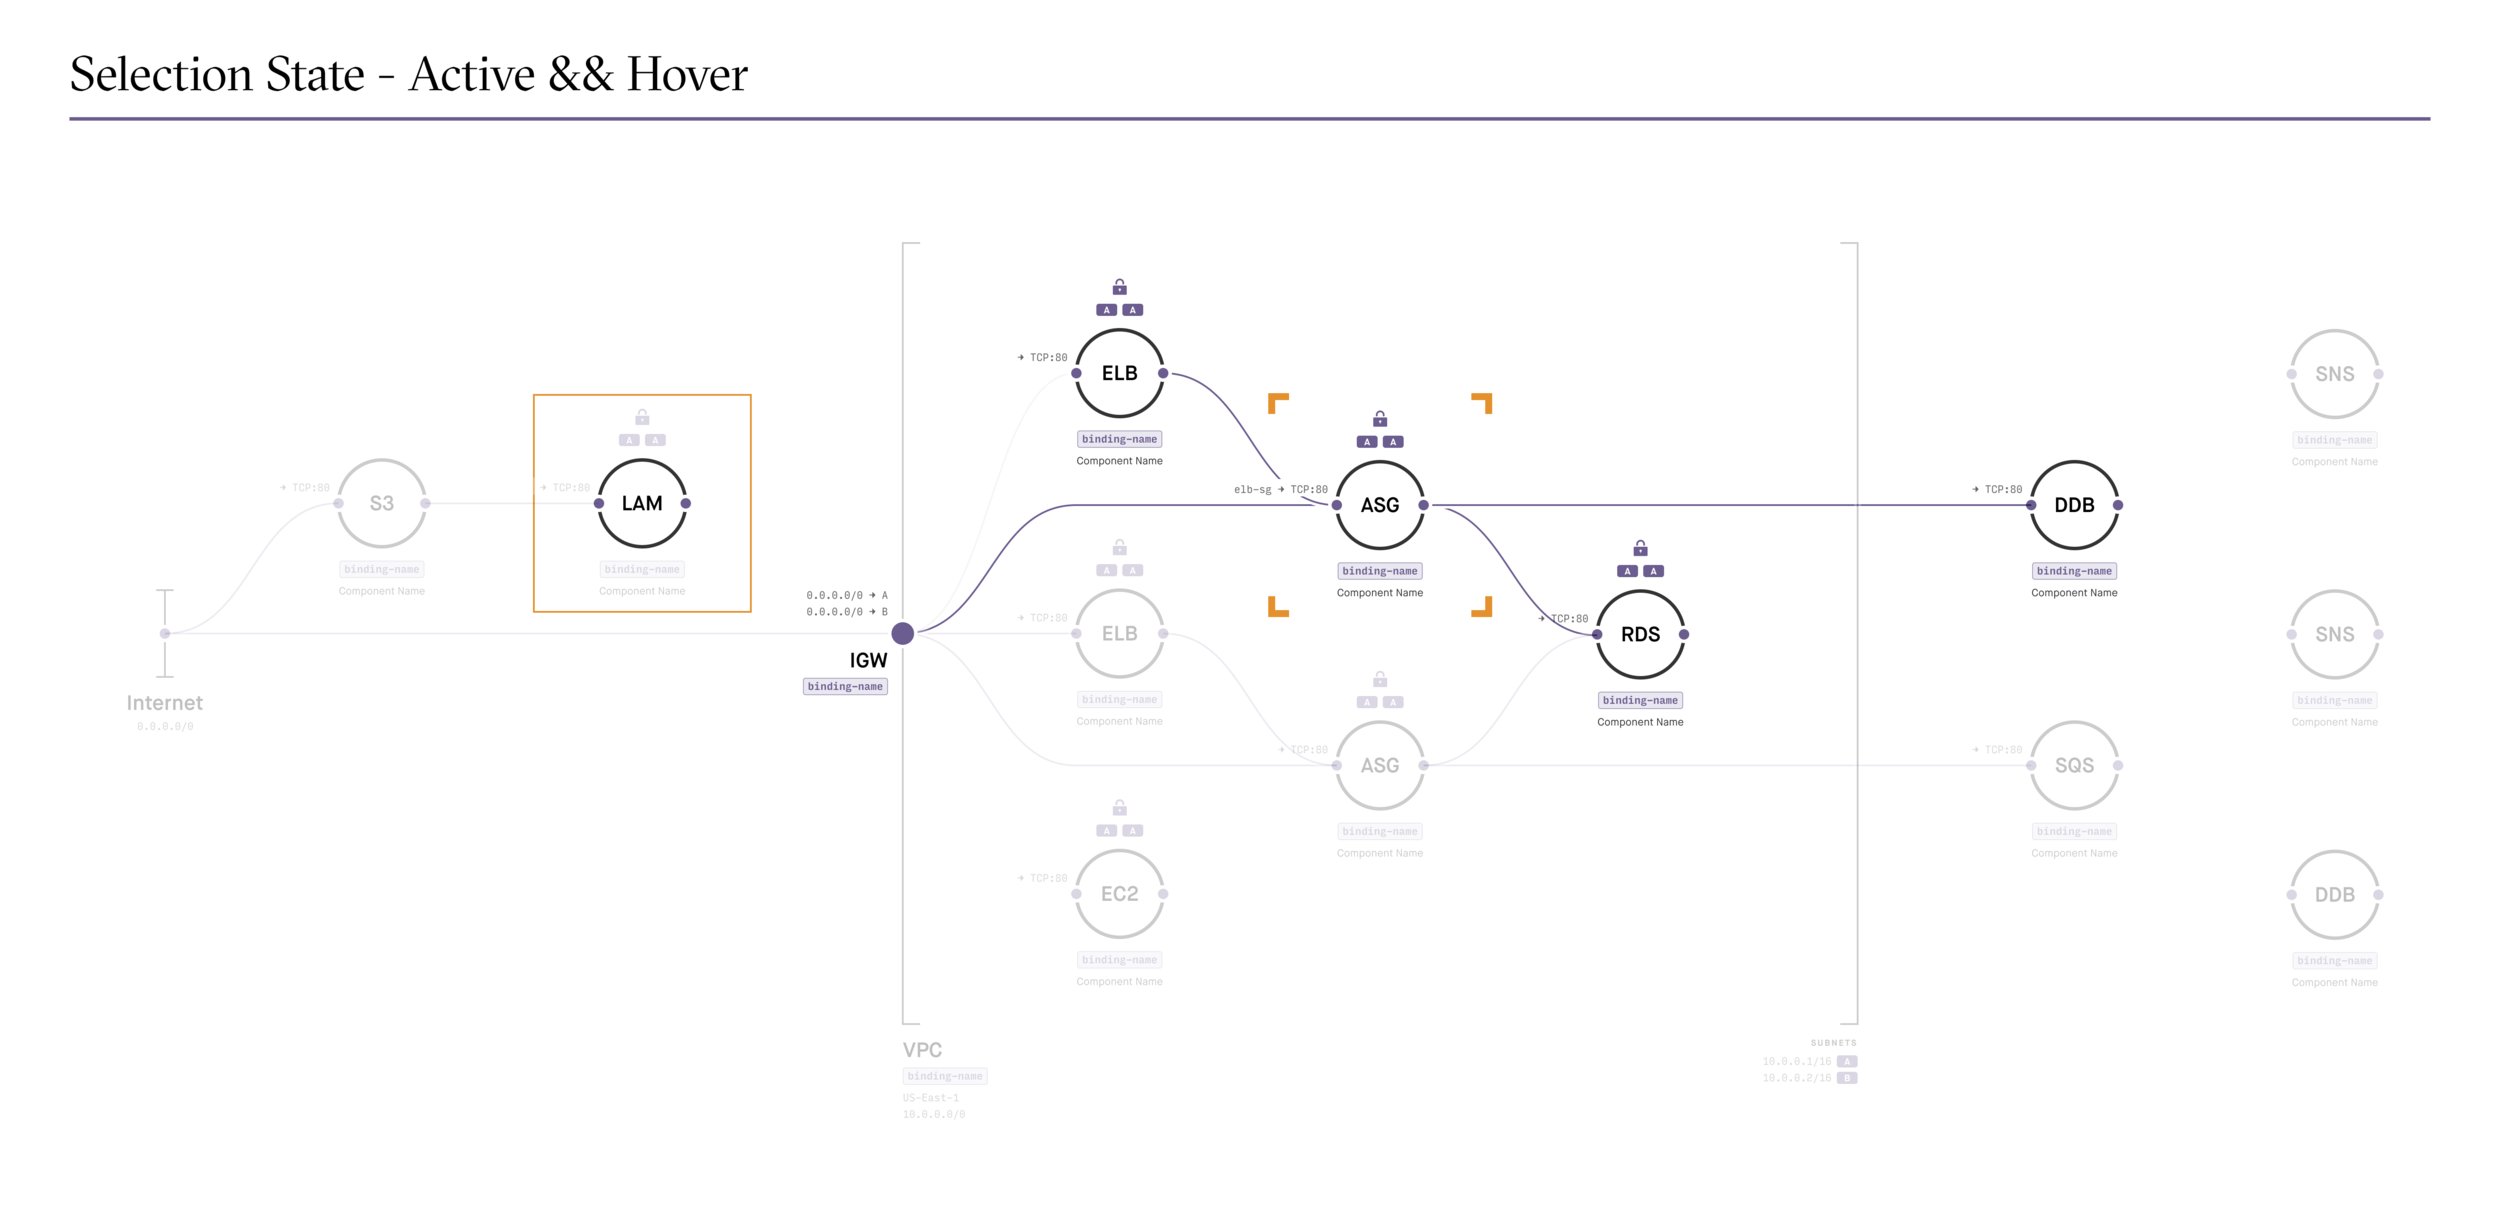
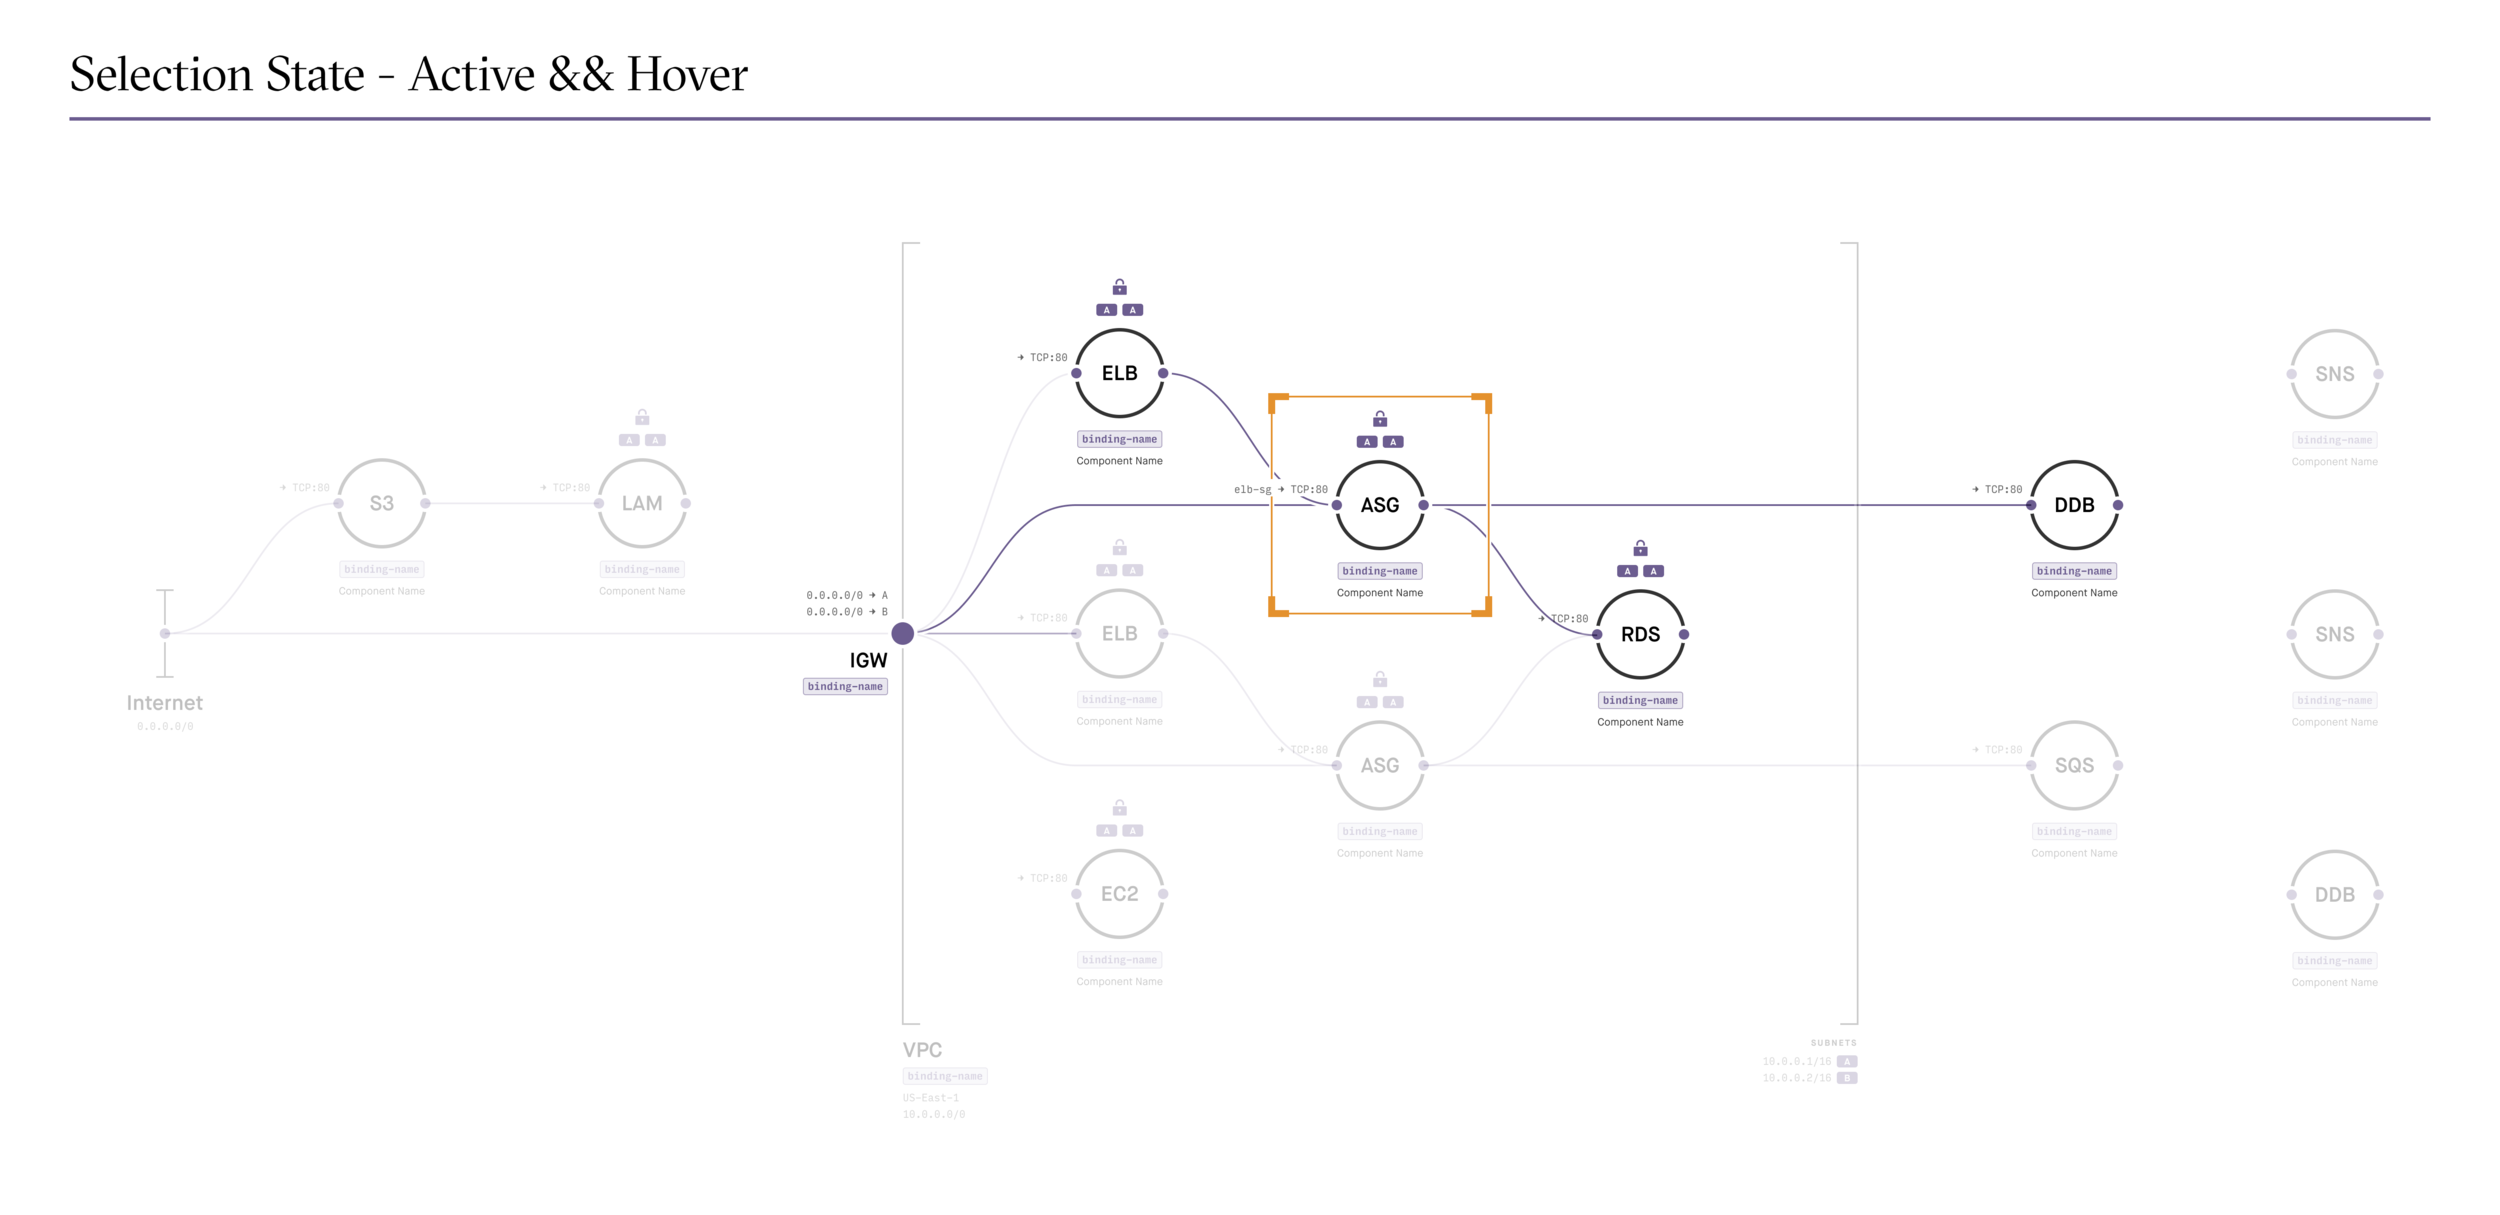
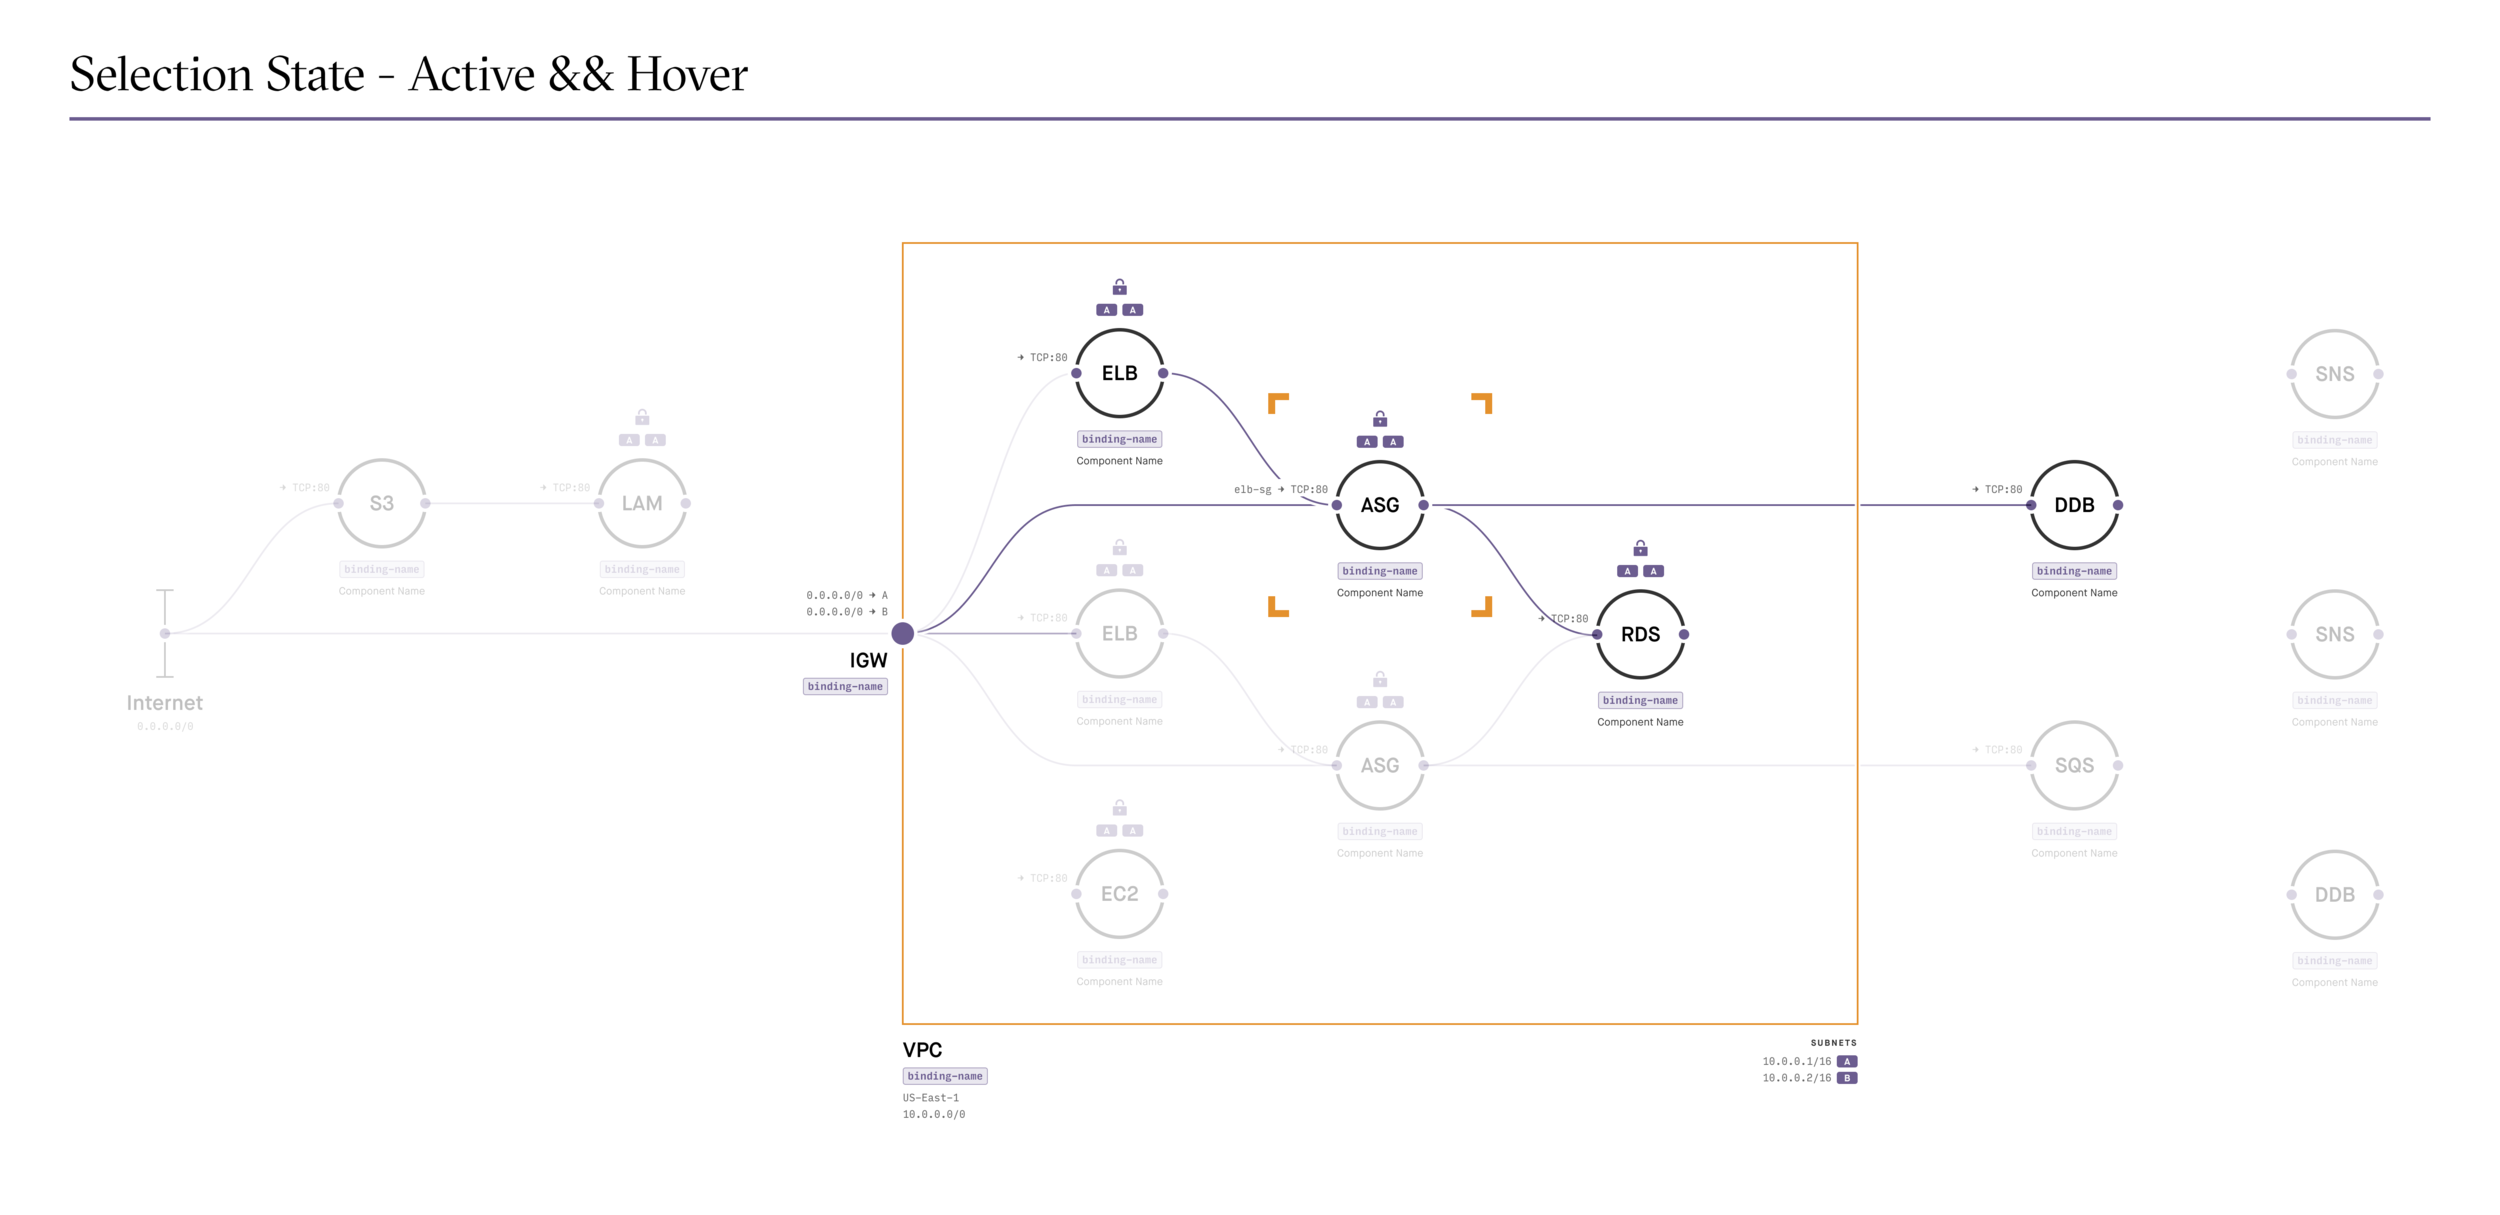
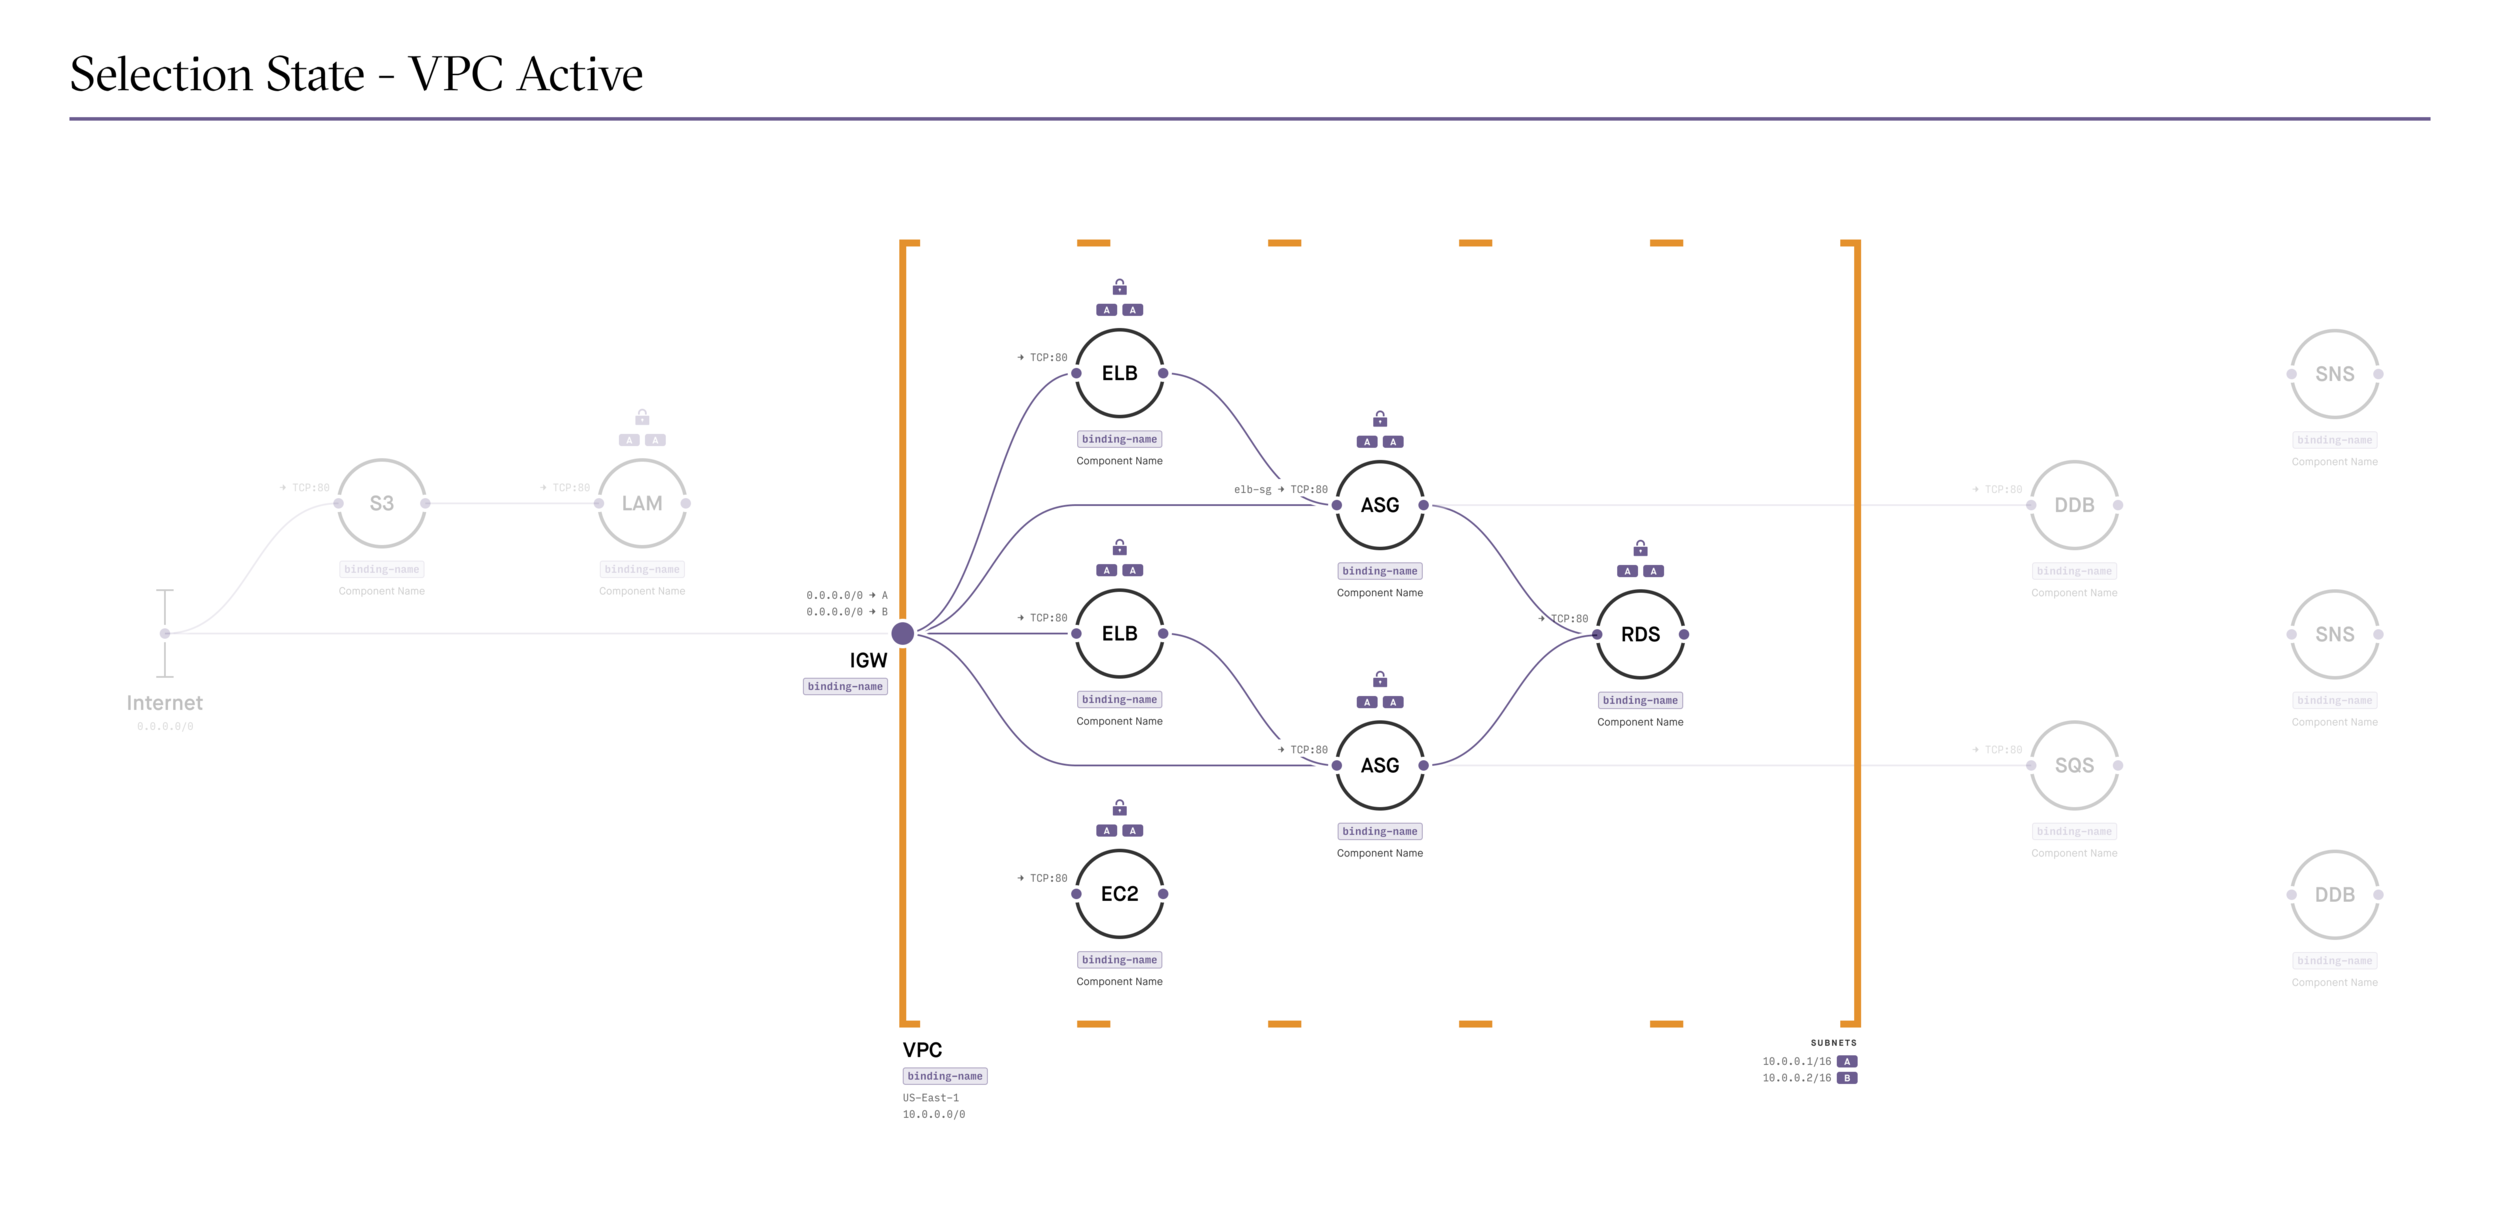
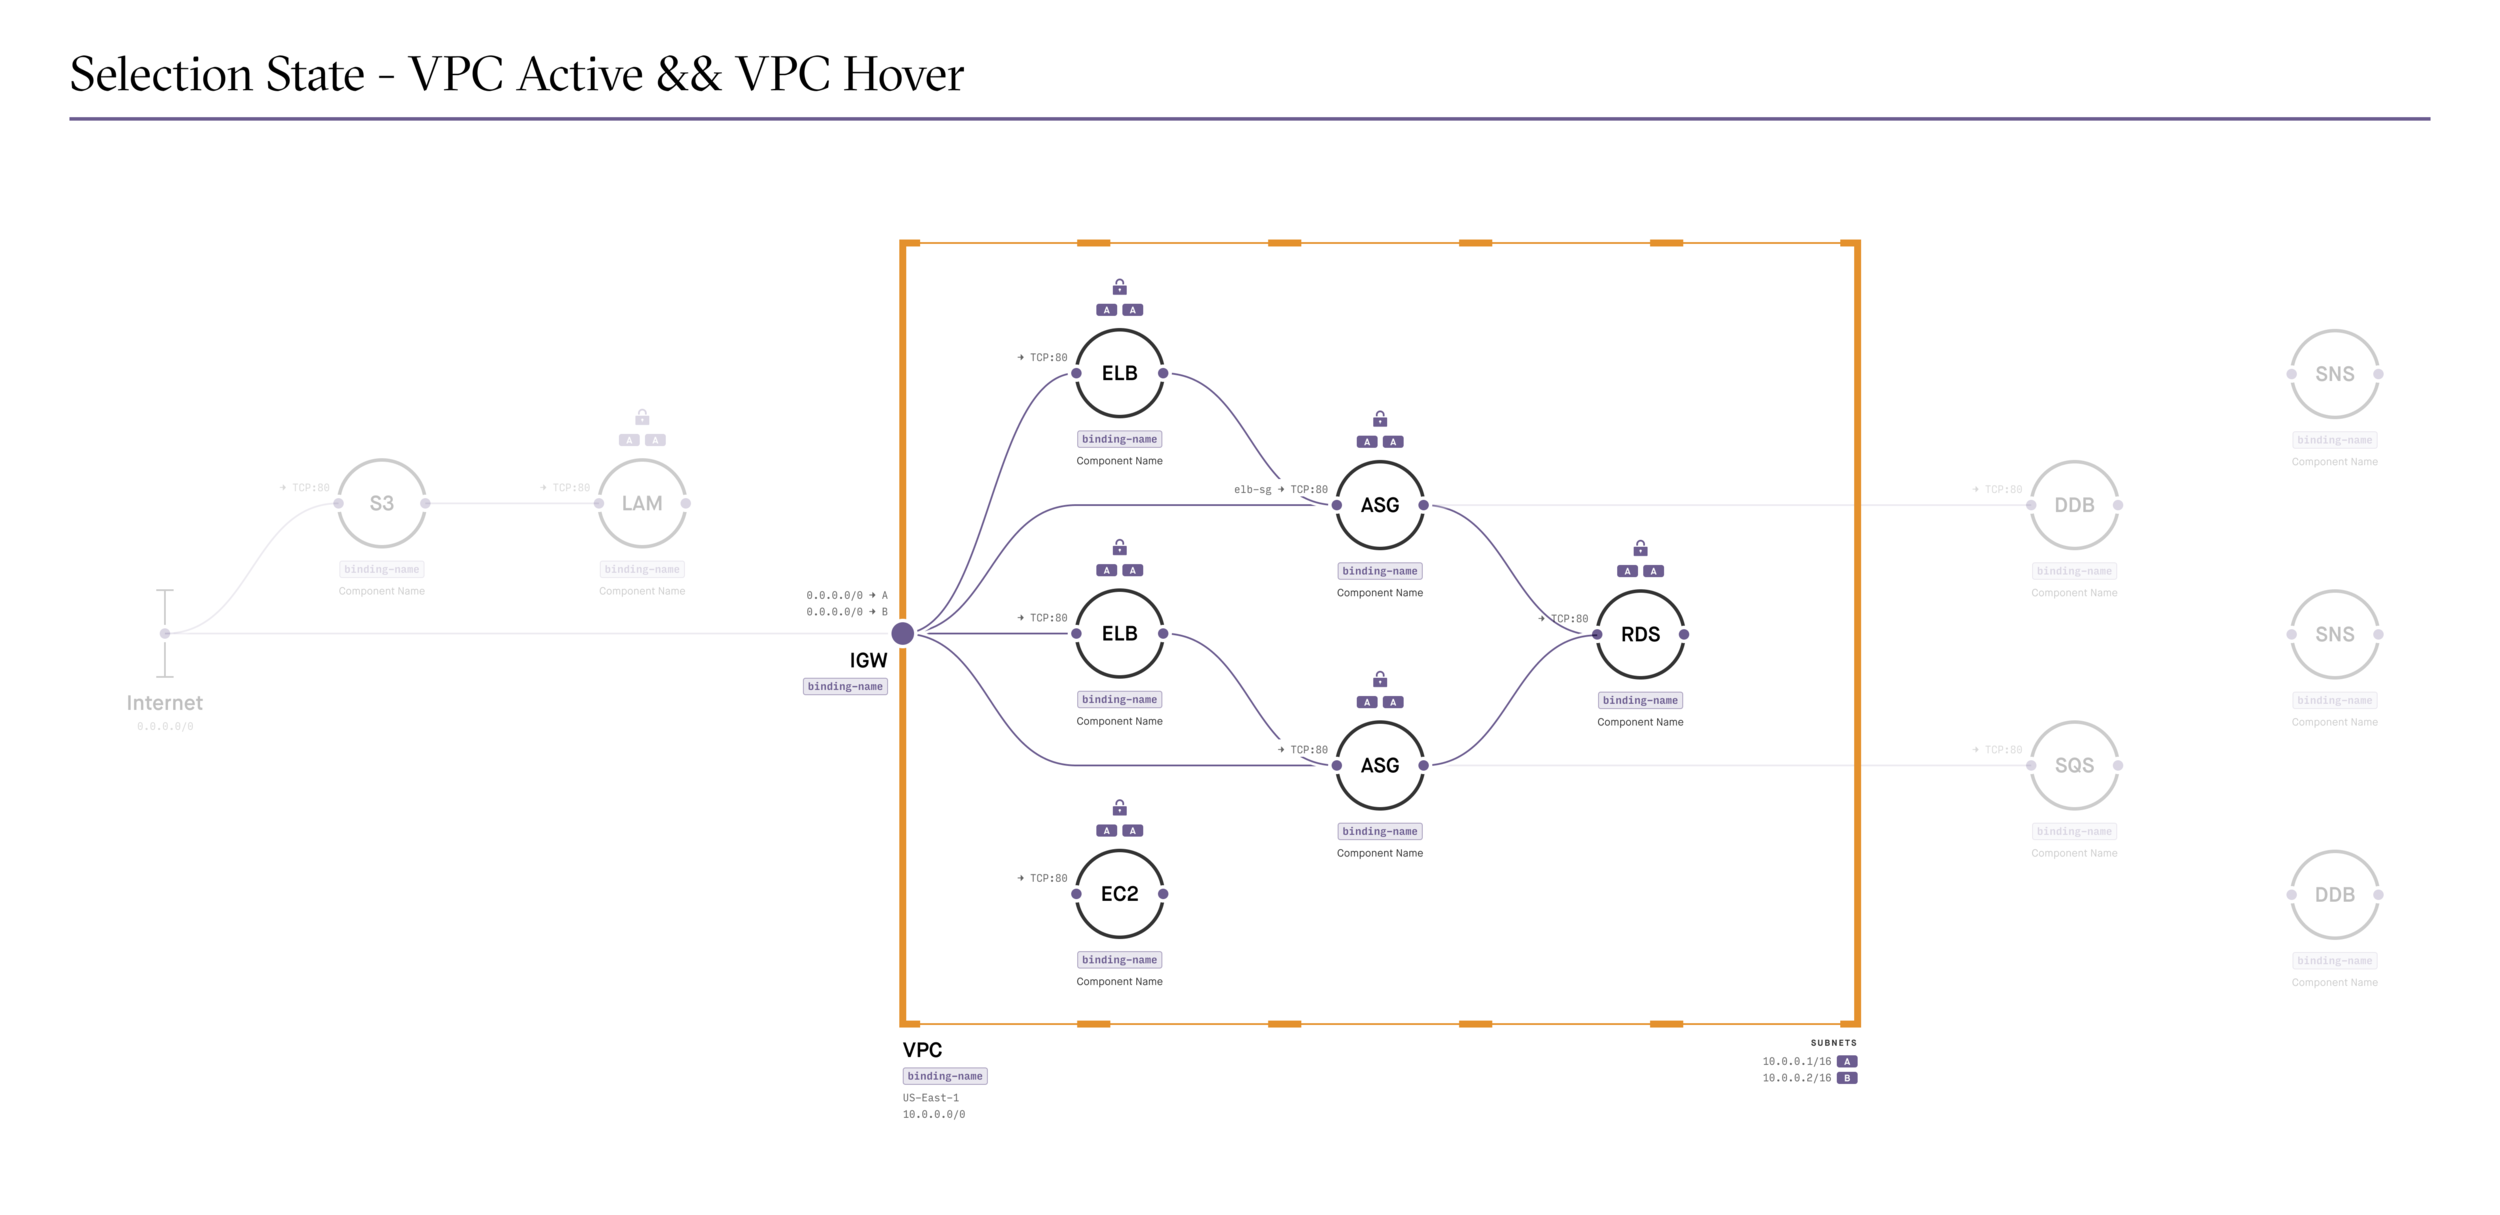
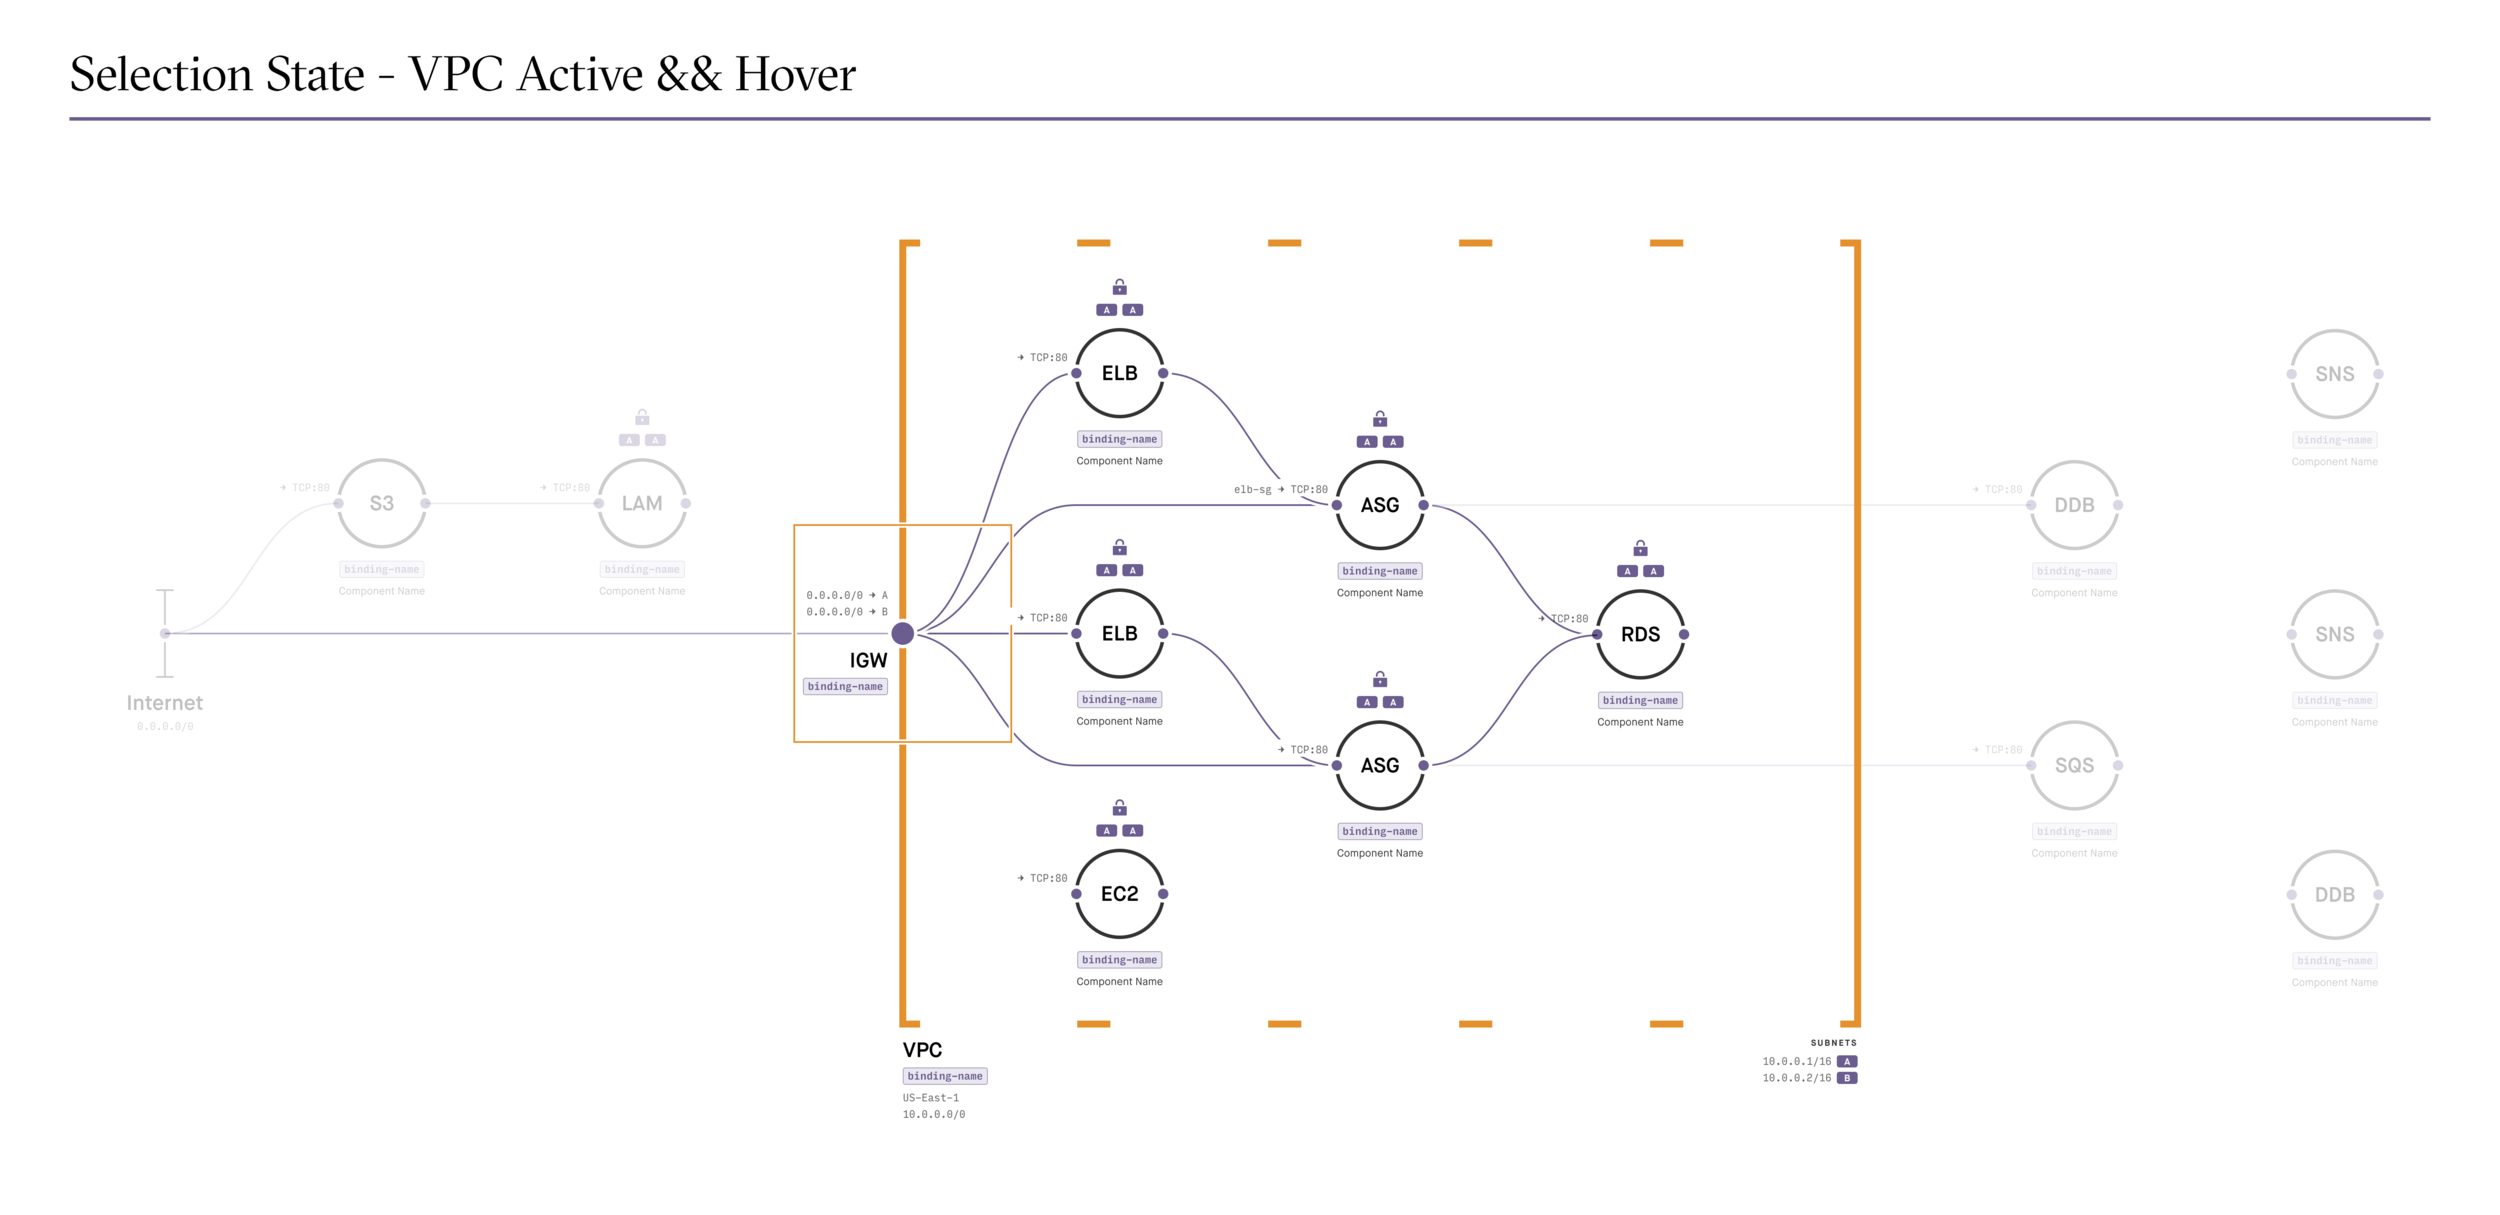
Interaction Design of Composer's Visualization
We wanted the visualization to be interactive. Users had the ability to pan and zoom to navigate the visualization. They could also click and hover on an element to trigger an "Inspector Panel" to appear that gives more information on what was clicked on. This required that we define visual states and behavior for the various visual elements.